NeRFF Mission
To provide emergency managers, community officials, and the public with a comprehensive, real-time collection of flood-related data, to support risk-based decisions regarding flooding.
NeRFF Goals
- Intuitively display up to date weather and stream gage stage data
- Provide flood inundation boundaries at every half-foot gage stage
- Provide flood inundation boundaries for each FEMA published recurrence interval
- Provide up to date flood information for Emergency Management and Response
- Prevent and reduce the loss of lives and property due to flooding for Nebraska residents
Gages
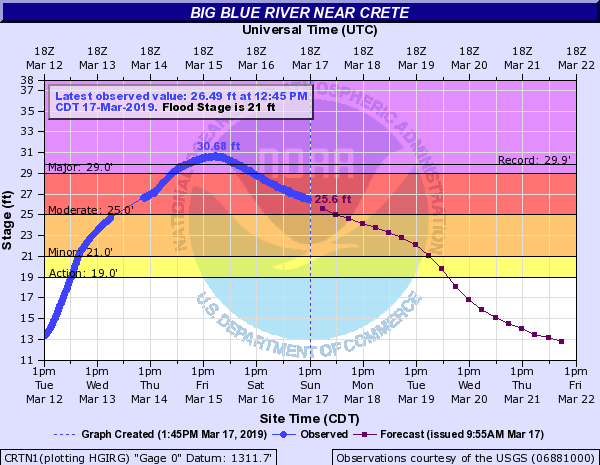
This web site currently provides real-time stage data for 46 gages across Nebraska. The stream gages are either managed by the United States Geological Survey (USGS) or the Nebraska Department of Water, Energy, and Environment (DWEE). Gage data is updated every hour with data points for every 15 minutes. During flood conditions, many gages will have forecasted stages provided by the National Weather Service (NWS). Along with current and forecasted stages, the record stage and corresponding year for each gage is provided in the flood simulator view.
The contributing watershed for each gage is available to view and, when paired with the weather radar, can provide a better understanding of the precipitation that has, or is expected, to accumulate upstream of the site. Radar data is updated every 5 minutes.
Stage trends for gage sites are updated hourly, and displayed as either rising, falling or constant. During high flow events, some gages have forecasted stage heights provided by the NWS during high water. For such sites, a halo in the color of the corresponding projected risk rating will be symbolized in the map.
Inundation Boundaries
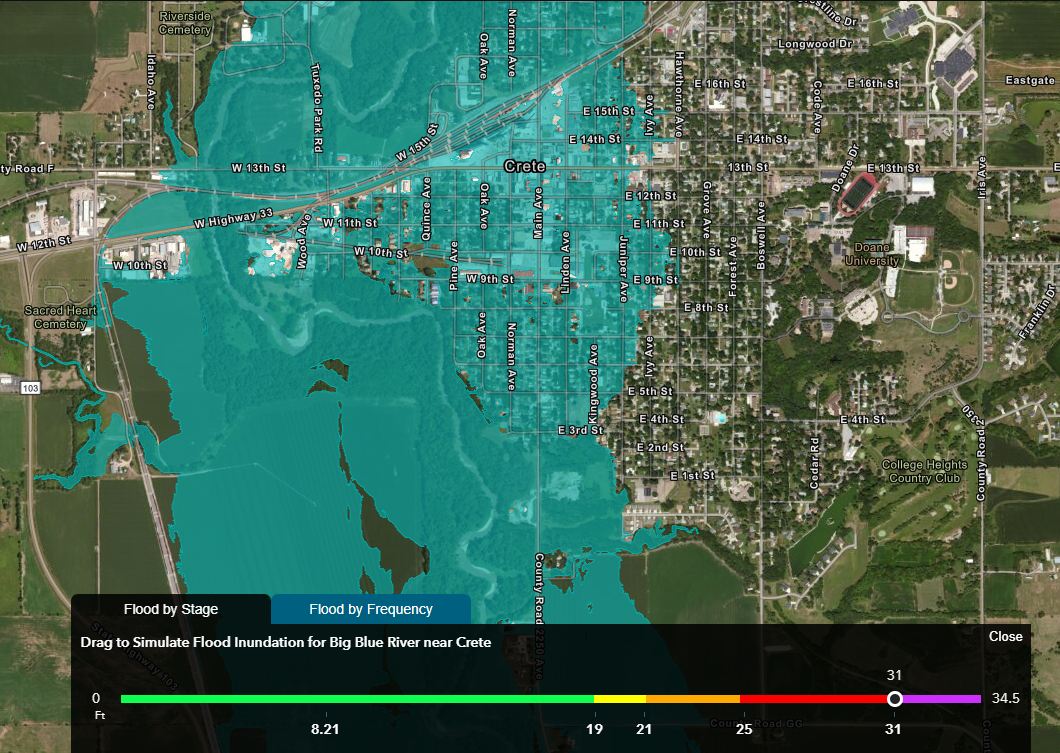
For select sites, hydraulic modeling was completed to estimate flood inundation boundaries at every half foot stage interval.
Along with the stage inundation, FEMA’s published discharge values based on the estimated annual chance of flooding (10%, 4%, 2%, 1% and 0.2%), or more commonly known as the 10-year, 25-year, 50-year, 100-year and 500-year flood events were also analyzed to model flood inundation boundaries.
For every inundation boundary, depth grids are also available to allow users to estimate the depth of flooding at a specific location. By combining forecasted stage data and the pre-calculated inundation boundaries, users can view projected inundation areas and depths to make informed emergency response plans. These inundation boundaries can be viewed when selecting the Flood Simulator option.
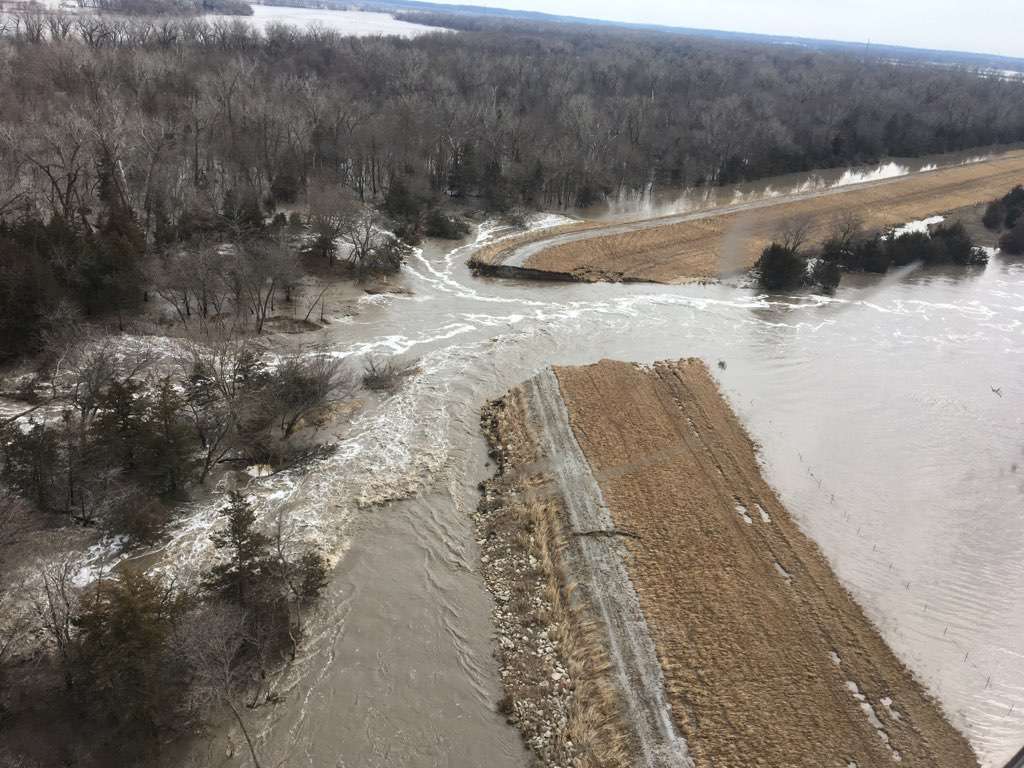
Flood Control Structures
All accredited levees, jurisdictional dams, and other flood control structures were assumed to perform their desired function, until overtopped. Additional caution should be used in areas containing such structures during a flood emergency.
Additional Data
Additional relevant data, such as critical infrastructure, NFHL data, and weather watches and warnings are available to support risk-based decision making.
Refresh Rate
Stream Gage Height: Hourly
Stream Stage Trend: Hourly
Weather Radar: every 5 minutes
Accuracy
Inundation boundaries have been calibrated to within 0.5’ of previously recorded stage heights during high flow events, for a minimum of 2 events. Inundation boundary results are expected to be most accurately represented closest to the gage site. Additional information regarding modeling efforts for each site can be found in the corresponding report, available by request.